The pfSense Remote Monitoring service continuously tracks the availability, performance, and functionality of your pfSense system, ensuring it meets expected standards. This proactive approach helps identify potential issues early, preventing them from escalating into critical problems. The service also includes checks to verify system integrity and ensure that any configuration changes to the system are authorized.
Our Essential service provides comprehensive monitoring of any Netgate device, tracking up to 100 key metrics on your pfSense appliance or server.
Designed for customers who prefer a hands-off approach, this service ensures you're kept fully informed with timely reports and notifications about potential issues. However, all decisions and actions remain entirely in your control, as we do not intervene or take any actions.
For those seeking a more proactive approach, where we handle pre-agreed actions to resolve issues as they arise, our Lite SOC service offers an ideal solution.
Lite SOC
This is a Semi-Attended Remote Monitoring service, offering all the benefits of our Essencial monitoring with the added advantage of proactive support during business hours. Each notification alert includes an IT Operations Code, providing a reference for specific instructions or procedures to be followed in response to the alert, ensuring clarity and actionable guidance.
The ITG SOC team can execute actions or procedures based on a pre-agreed set of instructions during business hours (Monday to Friday, 8 AM to 5 PM). This means we actively respond to and manage issues as they arise within these hours.
This package includes a top-up of 3 hours of dedicated effort to perform the pre-agreed actions or procedures. Additional hours can be purchased if needed, offering flexibility while maintaining focus on your specific operational requirements.
Key Features
Hands-Off Monitoring: Ideal for customers who prefer to manage their own IT.
Reports & Notifications: Stay informed with alerts sent directly to you.
Customer-Controlled Response: No actions are taken by us—decisions and responses are entirely up to you.
Proactive Option Available: Upgrade to Lite SOC for pre-agreed actions and proactive support.
Key Features
Semi-Attended Monitoring: Proactive support during business hours.
IT Operations Code: Alerts provide clear, actionable instructions.
Business Hours Response: ITG SOC team manages issues (Mon-Fri, 8 AM to 5 PM).
3-Hour Top-Up: Includes 3 hours for pre-agreed actions.
Flexible Hours: Additional hours available if needed.
How We Deliver pfSense Remote Monitoring
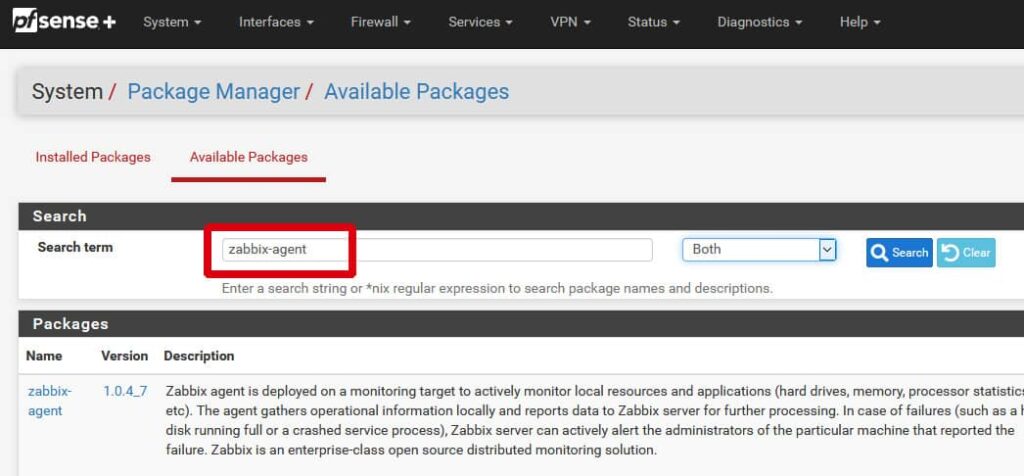
Our Monitoring Solution leverages the robust capabilities of the Zabbix agent, which comes as an installable package on both pfSense Community Edition and pfSense Plus.
Once installed, the agent is configured to securely connect to our cloud Zabbix servers using the Transport Layer Security (TLS) protocol 1.3, ensuring that all data transmissions are secure. The Zabbix servers collect metrics from the monitored system, which are then used to generate reports and notifications via email and/or phone calls, depending on the customer's preference.
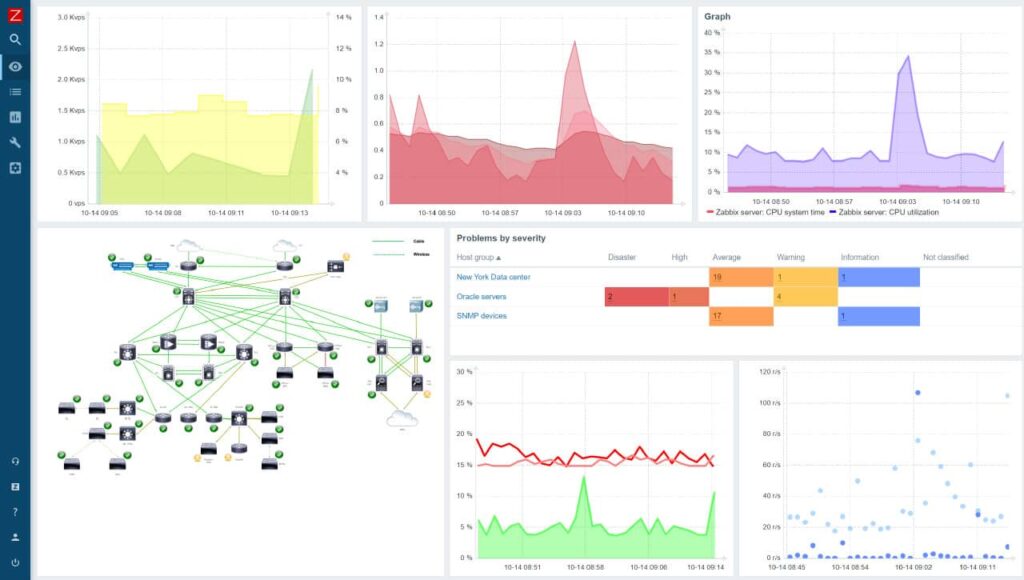
Customers are granted access to a user-friendly graphical user interface (GUI). This GUI allows for near real-time visualization of system status, graphical plotting of collected metrics, and an overview of both active and historical alerts. This approach not only enhances system management through precise monitoring but also empowers our customers with deep insights into their system’s performance.
Example of Monitored Metrics for a Netgate 7100
CPU
Context switches per second
CPU idle time
CPU interrupt time
CPU nice time
CPU system time
CPU user time
Interrupts per second
Processor load (1 min average per core)
Processor load (5 min average per core)
Processor load (15 min average per core)
OS
Host boot time
Host local time
Host name
Maximum number of opened files
Maximum number of processes
Number of logged in users
System information
System uptime
General
Host boot time
Host local time
Host name
System information
System uptime
Processes
Number of processes
Number of running processes
Security
Checksum of /etc/passwd
Checksum of /cf/conf/config.xml (running config)
Number of logged in users
Filesystems
Free disk space on /
Free disk space on / (percentage)
Free disk space on /var/run
Free disk space on /var/run (percentage)
Free inodes on / (percentage)
Free inodes on /var/run (percentage)
Total disk space on /
Total disk space on /var/run
Used disk space on /
Used disk space on /var/run
Performance
Context switches per second
CPU idle time
CPU interrupt time
CPU nice time
CPU system time
CPU user time
Interrupts per second
Processor load (1 min average per core)
Processor load (5 min average per core)
Processor load (15 min average per core)
Memory
Available memory
Free swap space
Free swap space in %
Total memory
Total swap space
Zabbix Agent
Agent ping
Host name of zabbix_agentd running
Version of zabbix_agent(d) running
Network Interfaces
Incoming network traffic on enc0
Incoming network traffic on ix0
Incoming network traffic on ix1
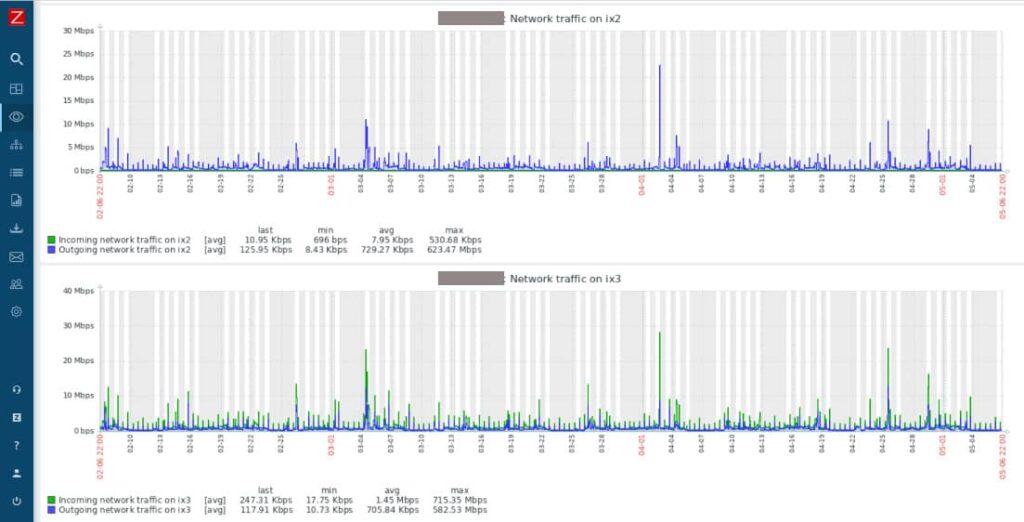
Incoming network traffic on ix2
Incoming network traffic on ix3
Incoming network traffic on lagg0
Incoming network traffic on lagg0.4090
Incoming network traffic on lagg0.4091
Incoming network traffic on pflog0
Incoming network traffic on pfsync0
Outgoing network traffic on enc0
Outgoing network traffic on ix0
Outgoing network traffic on ix1
Outgoing network traffic on ix2
Outgoing network traffic on ix3
Outgoing network traffic on lagg0
Outgoing network traffic on lagg0.4090
Outgoing network traffic on lagg0.4091
Outgoing network traffic on pflog0
Outgoing network traffic on pfsync0
Example of Security Email Alert
ITOC-001234-0001 - Configuration Change Detected on {HOST} ---------- Operational data: The ITG monitoring system has detected a change in the running configuration of {HOST}. Please verify whether this change was scheduled and authorized.
ITG Shop is a trading name of IT and General Limited, registered in England and Wales with registered number: 09291031 and registered office: 20-22 Wenlock Road, London, N1 7GU. | VAT Reg. No: GB223541733